TLDR: I’ve been working on a cryptocurrency trading bot that you can follow live on Telegram. It’s currently doing simulated trades on all Binance perpetual futures pairs. If the results are promising, I will run it with a real budget.
If you look at the history of the channel you can see how the bot performed in the past weeks of testing, but keep in mind that the code was changing fast and some of what you see might be tests/debug messages.
If you want to know more, keep reading!
Update 31/05/2021: See how Traderino performed during his first week of trading
I’ve recently started dabbling in cryptocurrencies again, and specifically in cryptocurrencies trading. Who doesn’t like the chance to get rich quick with a 50x long on Bitcoin?
As it turns out, it’s not that easy. If you have strong hands and can hold for months, the best strategy might be to spot buy and hold. But if instead you always feel the urge-to-do-something™, and want to see that PNL go up fast, you are probably thinking about day trading.
That can work for you, as long as the urge-to-do-something™ doesn’t bring you into bad trades. And that was happening with me: I realized that I was losing money due to my eagerness of opening new positions. Despite this, the rules I was using seemed to be okay, and it seemed like they could somewhat work if I just applied them as intended.
For these reasons, I thought of redirecting my efforts into building a bot that could trade based on the same rules, with the difference that it would not rush into new positions due to FOMO. Building a trading bot has always been an idea that came to my mind frequently anyway (and actually attempted a few times in the past) because it’s an interesting problem to tackle and because you feel you can get lucky and make some good money.
Of course, I’m fully aware that creating a profitable system that works over time is very hard or impossible, but it’s too fun of a project anyway, even if it turns out I’ve not discovered the Holy Grail of algo-trading.
The basics
The bot uses a trend-following strategy which consists of entering long positions when two conditions are met:
- we are in an uptrend;
- the price is temporarily decreasing (i.e. there’s a “dip”).
Alternatively, it will enter a short position when there’s a downtrend and the price is temporarily increasing.
To implement this strategy we need a criterion to identify the current trend and another to identify temporary counter-trend movements. There are multiple ways of achieving this result, but I settled on the mighty Supertrend indicator developed by Olivier Seban, which was what I was already experimenting with during my manual trading.
Supertrend basically provides us with an indication of whether we are in an up or downtrend, and what the price level is for this trend to invert. The indicator comes with two parameters that specify how sensible the result is with respect to the price movements (called “multiplier”) and how many previous candles to consider during the computation (the “period”).
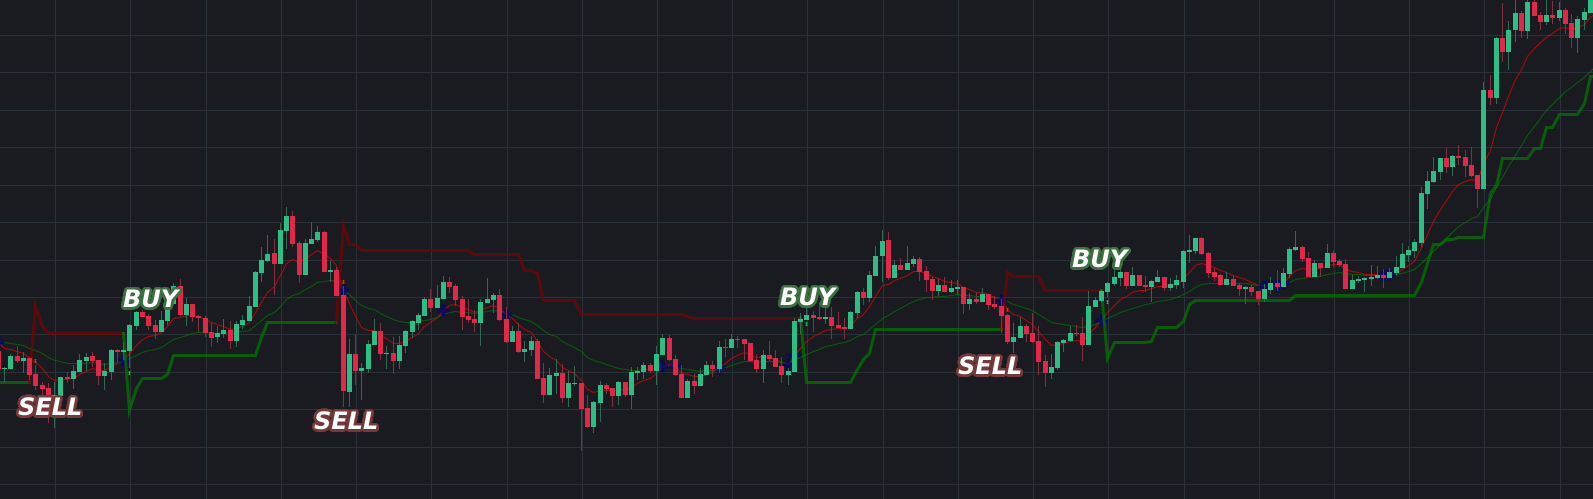
This image shows the Supertrend with default parameters (period=10, multiplier=3) on the ETHUSDT pair on the 15m timeframe. The Supertrend line indicates the current trend: if it’s above the price (and colored red) we are in a downtrend, if it’s green and below the price, we are in an uptrend. The basic strategy is to enter a trade when the trend reverses, as shown in the figure.
By the way… be aware that if you look online at other plots about this strategy, they will often be visualized in a very misleading way.
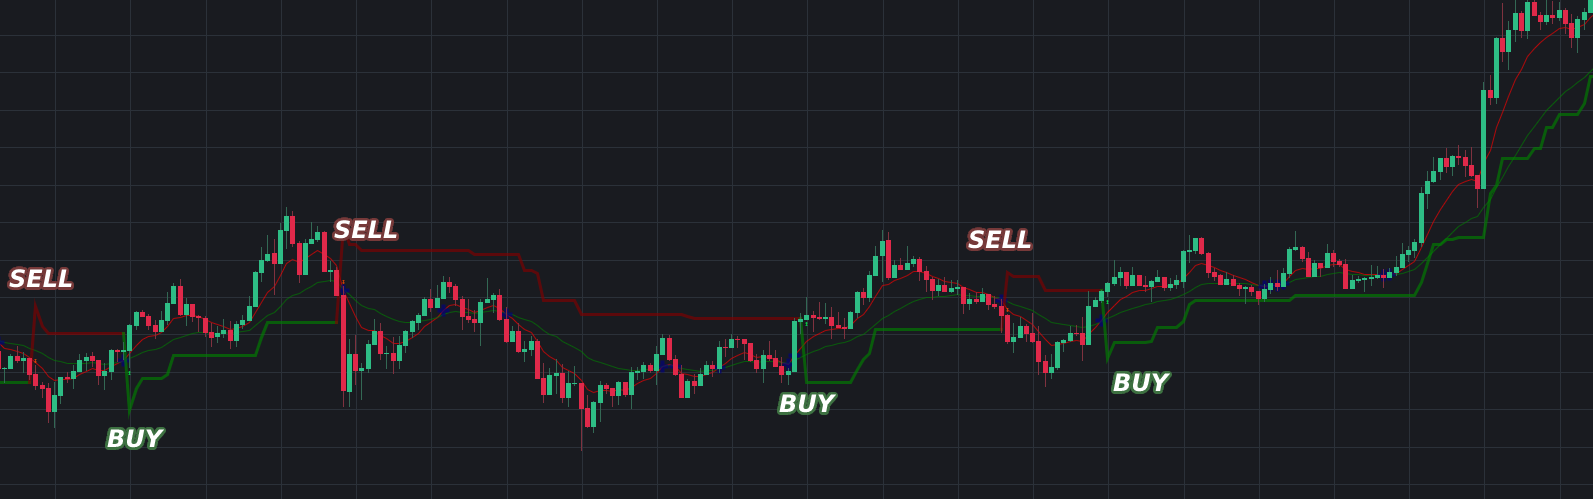
It’s the same plot as before, but I’ve placed the SELL labels higher and the BUY labels lower. This subtle change makes you subconsciously think that when you open a trade the price will be close to where I placed the SELL or BUY labels.
In reality, at the time you get the signal, that is, when the candle has closed, the price has already dropped/increased by a significant percentage.
This becomes evident if we take into account the second SELL signal in the plot. With the first visualization, it’s clear that it’s a false positive: when the candle closes (i.e., at the time we get the signal) a short trade would clearly be a loss. Just inverting the placement of the BUY/SELL labels, can give the wrong impression of this trade being profitable if one’s not looking carefully enough.
Enhanced Supertrend Strategy
What I just mentioned is just the most basic usage of the Supertrend that I’ve found online. After experimenting with it for a while, I realized it generated a lot of false positives so I looked for possible improvements.
The first thing I did is to add a second Supertrend indicator to use in conjunction with the first one. We’ll call them the short-term and long-term Supertrend. The difference between the two is that the short-term Supertrend runs with period 10 and multiplier 3, while the long-term Supertrend runs with 30 and 9.
This second indicator is used to look at things from a wider perspective. We only take trades where both indicators agree: that is, both indicators must tell us that we are in an uptrend or downtrend in order to enter a position. The intention is to filter out false positives.
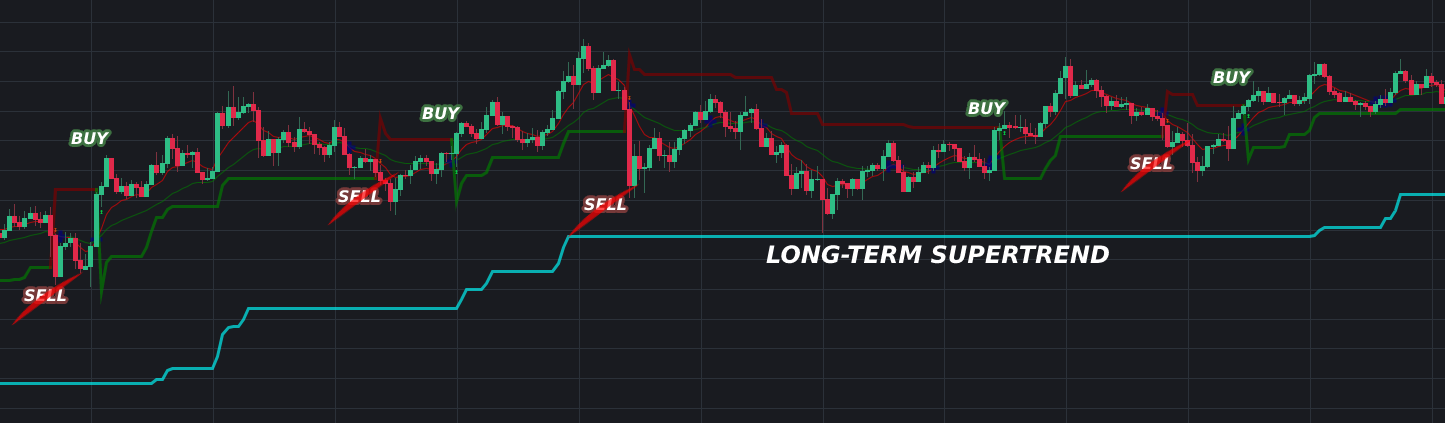
In this case, the long-term Supertrend lies below the price (the color is cyan just not to confuse me with the other Supertrend), so we are in an uptrend. Therefore, we will only take long trades and ignore all sell signals. Conversely, we would only take short trades if the long-term trend is downwards.
The other major variation that I implemented is to not enter a trade immediately after the trend has inverted, but instead wait for a bounce on the Supertrend line. Let’s look at an example:
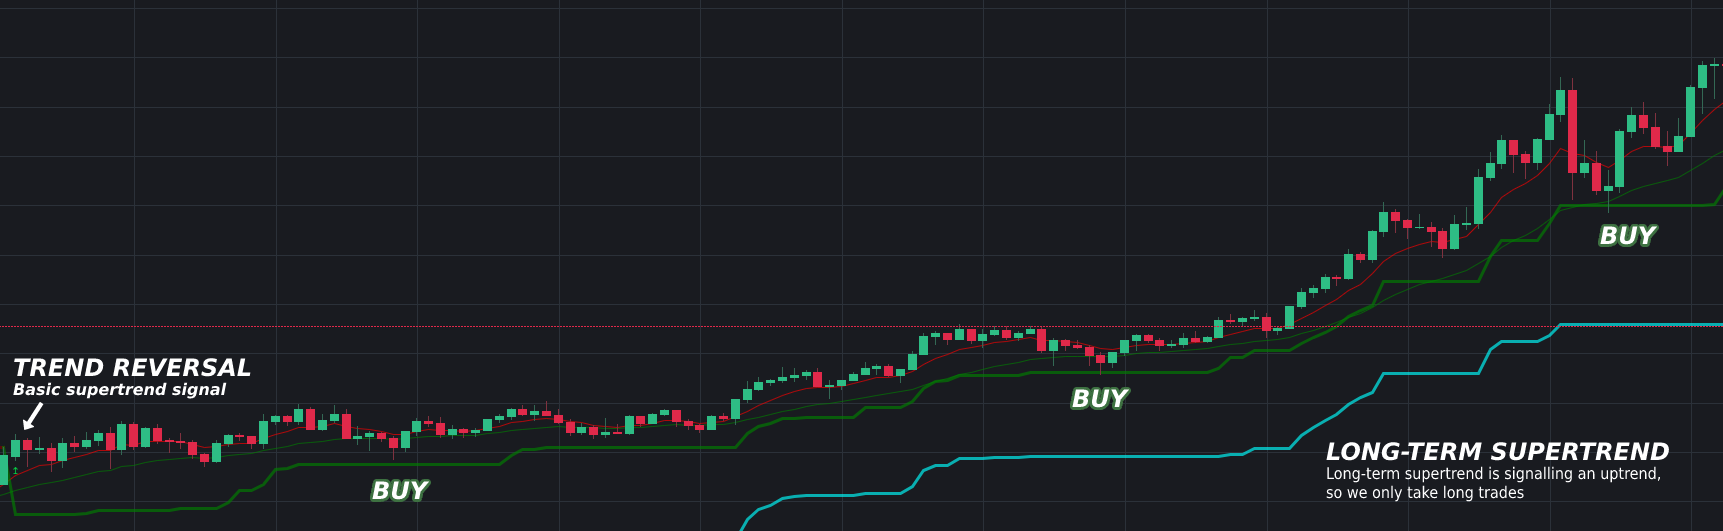
The plot is from the 1h ETHUSDT pair on Binance. We see the “basic” Supertrend signal at the start, but with the new strategy we don’t take the trade right away. Instead, we wait for the price to bounce off of the Supertrend line (or at least at a certain distance threshold) to enter. The idea is that we can probably get a better entry if the price drops, but we can expect it to go up afterwards because both indicators are telling us that we’re in an uptrend.
Of course, the problem with this strategy is that when the Supertrend line gets pierced instead of acting as a support level, our trades will hit a stoploss. However, if we are in a strong trending market, we can reasonably make the assumption that the trend will continue more than enough times to compensate our losses when it doesn’t.
Meet Traderino
Traderino is running 24/7 trying to apply this Supertrend strategy to Binance futures pairs.
For every pair he looks at different timeframes from 30m to 1d, so he’s effectively monitoring more than 500 “data feeds”. To do so efficiently, he doesn’t look at every pair with the same probability but samples them based on their distance from the current Supertrend line.
For example, if the price is at a 10% distance and we want it to be at a 0.1% distance to open a trade, it’s very unlikely that it’ll get there anytime soon. Traderino will thus focus his attention on other pairs where the price is closer to a good entry.
Also, there are a number of other features that I have not mentioned which I will just give a brief overview of:
- When the price is close to the Supertrend, Traderino also looks at the RSI in order to decide whether to actually open a position;
- Take profit and stop loss levels are set according to the timeframe. When a take profit is hit, Traderino can decide to either close the position and take the profits, or activate a trailing stoploss and extend the take profit. This decision is made based on how fast the price has moved in our direction;
- While doing all this, he will also keep an eye on the volatility of the BTCUSDT price. Cryptocurrency prices are known to be highly correlated with Bitcoin, and if a sudden drop/spike happens there, Traderino will enter “panic mode”. In this mode, he can suddenly close positions to avoid extreme losses and can stop trading on a given timeframe until volatility levels return to normal.
He reports every action publicly on his Telegram channel, and from time to time he sends a status update containing the currently open positions or a recap with some stats about closed trades.
This is what a status update message looks like:
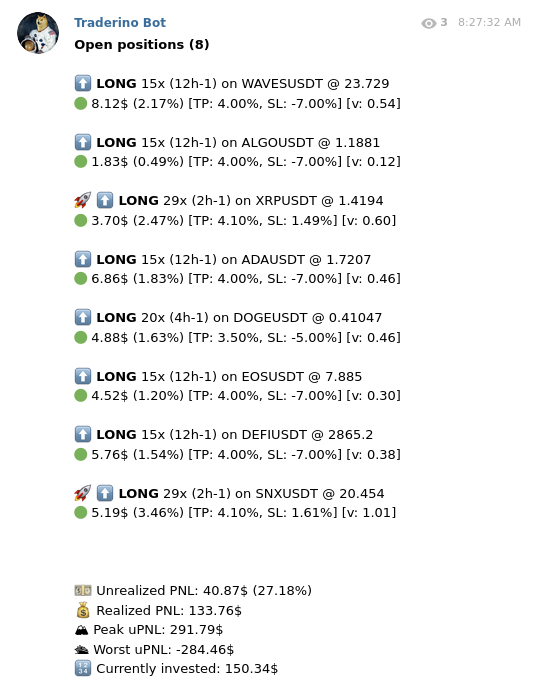
For each open position we have a bunch of information. On the first line:
- The side: LONG or SHORT
- The leverage (15x, 29x, etc…)
- The timeframe where the signal originated, plus the number of candles that this position has been open. For example (4h-3) means that the position has been open for approximately 12 hours
- The pair and the entry price
On the second line:
- The current profit, in USD and %
- The current take profit and stop loss values
- The “velocity“: a measure of how fast the price is moving in order to decide whether to close the position or activate the trailing stop loss and extend the take profit
Positions which have a rocket have had their trailing stop loss activated. The XRPUSDT position has, in fact, a positive stoploss, meaning that we will still make profit in the worst case scenario.
When Traderino finds an opportunity it will generate a signal, which will look more or less like this:
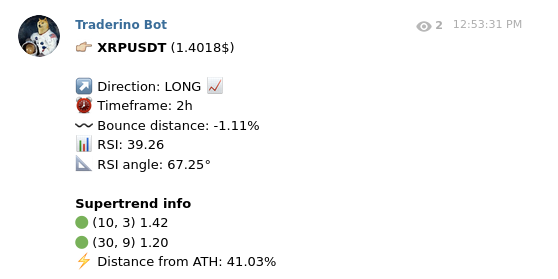
The important thing here is that he’s going to open a position, along with a bunch of other stats about RSI and distance to the supertrend or ATH.
To keep the length of the article reasonable, there’s some stuff that I haven’t mentioned and details that I didn’t explain fully. Feel free to leave a comment if you have any question and I’ll be happy to respond. Also, please keep in mind that this is a work in progress, so things may change as I develop more stuff or tweak various parameters.
First results
Traderino has been running for several days now, but only doing simulated trades. Some more testing will be needed before he’ll be ready to trade with real money.
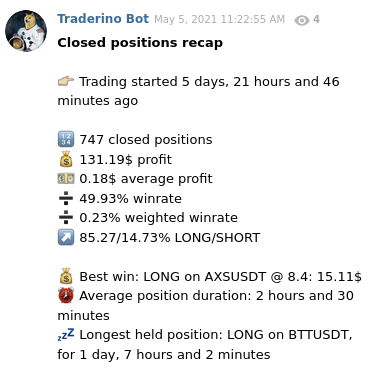
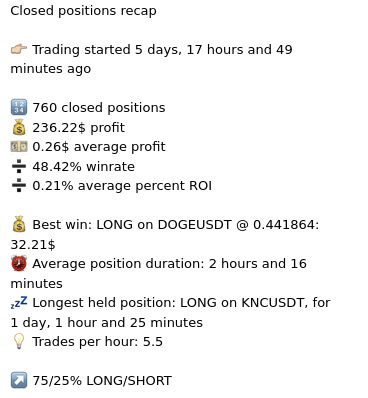
For the moment, though, he’s been performing pretty well. The first two 5-days session ended up with him in profit:
While I’m writing this, Bitcoin price has plummeted to 30k and Traderino is trying to navigate these hard times safely. He lost everything, but, at a certain point during the bounce, he was up around 1k$, although it might not be obvious from the plot.
These highly volatile times are not the ideal environment for this kind of strategy anyway, and I would’ve considered closing all positions manually if he was trading with real money at that time.

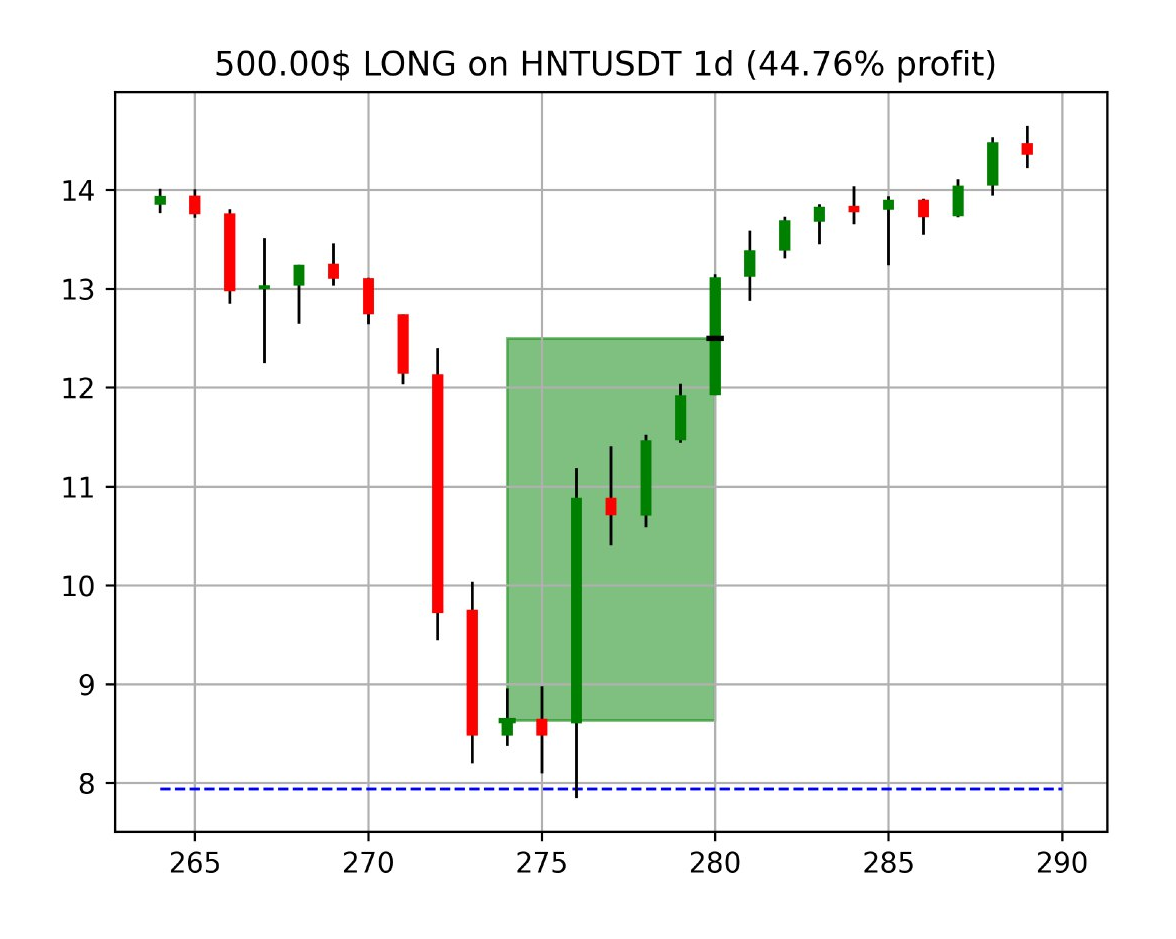
This one has been his best trade so far:
If you look at the Telegram channel history you will all of his activity in the past few weeks.
I realize it can be a bit hard to follow, as it contains thousands of messages, and some of them are me testing the system. That’s why I’m also working on tuning the amount/content of messages to improve the user experience of the Telegram channel.
Final thoughts
For sure it’s been very fun to develop Traderino and follow his adventures on the markets. It’s clear that this strategy might work well only in strongly trending markets, which probably is not the case with cryptocurrencies right now, and especially this last week.
However, I’m continuously looking for ways to improve the system and actively developing. I would be glad to hear any feedback/question in the comment section!
For now, let’s see how Traderino will do for the following few weeks and if he’ll deserve to chance to handle some real money.
